Starting the debugger
After defining breakpoints, you can run your test procedure through the debugger.
Press F4 on your keyboard. Alternatively, select Execution > Debug > Go from the menu.
In the Debug Test dialog box, click the Debug button.
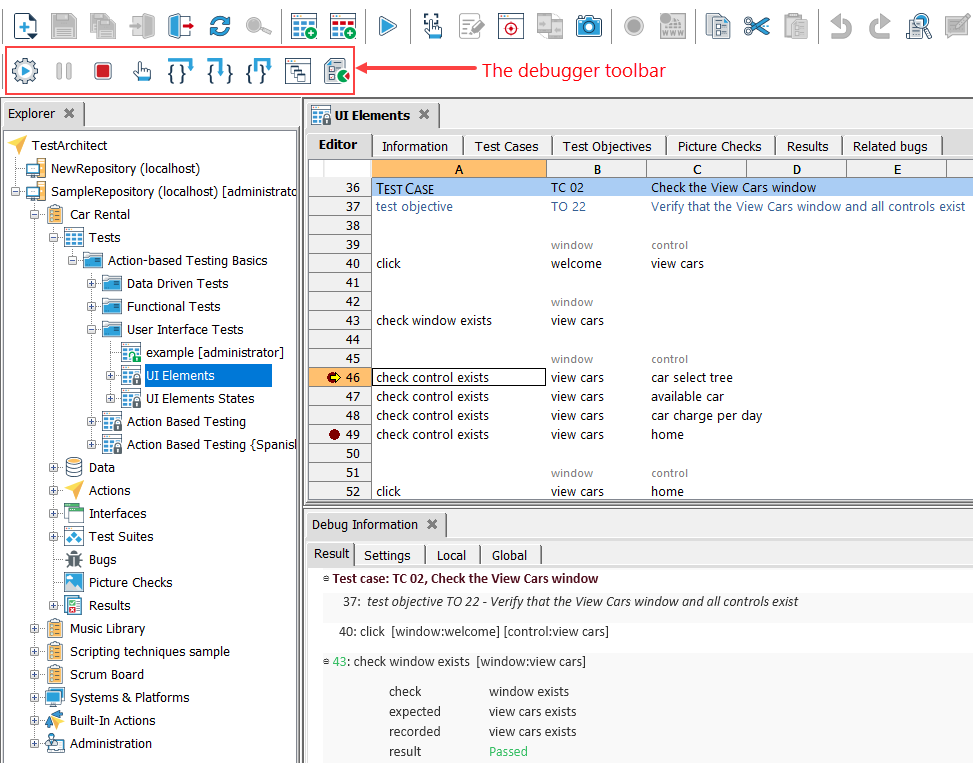
TestArchitect provides buttons in the toolbar for controlling the execution of the action lines you are debugging. Typically it is easier to use the corresponding shortcut keys to control this execution. Use the Shift + F5, Shift + F6 and Shift + F7 keys to step through your lines. The functions of these keys are explained in the following table.
Key Description Keyboard shortcuts Debug Click this button to run the test module in debug mode. Execution is paused at the next breakpoint, if any exists. N/A Pause Pause the test execution. N/A Stop Terminate the test execution. N/A Toggle Breakpoint Insert or remove a breakpoint. Ctrl + Alt + B Step Over Execute an action (or a “run test” test module) and break on the next line in the current test module or action definition. Even if the action is defined with a user-created action definition, do not break until execution returns from that action. Shift + F6 Step Into If the current action line calls a test module or an action definition, pause at the first action line inside the test module/action. Shift + F5 Step Out Execute all remaining action lines within the current test module/action. Do not break until control returns to the next action line of the calling test module or action definition (if it exists). Shift + F7 Call Stack Display the current call stack. The call stack shows all levels of actions/test modules which are currently being executed and how they relate to each other. N/A Debug Information Display the result window. N/A The screenshot below displays a test module in debug mode.
 Notes:
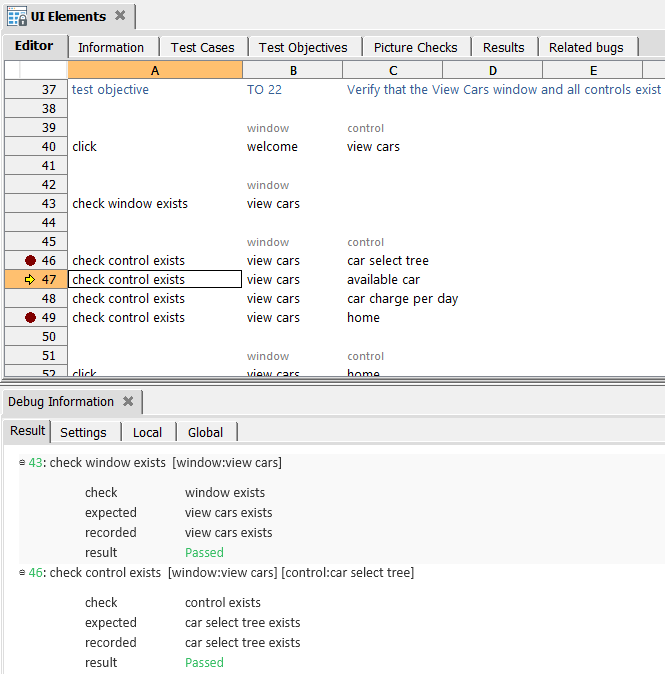
- The red dots in the row headers specify where breakpoints have been set.
- The yellow arrow in the row header indicates the point at which execution is currently paused.
- The Debug Information view allows you to manage the debugging of an automated test. This view contains four tabs of information:
- Result: Presents the results of executed action lines preceding the current breakpoint.
- Settings: Displays all the settings explicitly used by the test, and their values.
- Local: Displays all defined local variables visible at the breakpoint. All duplicate local variables are also displayed, along with their scopes. The first column in the grid view shows the names of the variables. The second column indicates where the variables are declared. The third column displays the values of the variables.
- Global: Shows global variables that exist up to the breakpoint. The first column in the grid view shows the names of the global variables. The second column displays the values of the variables.
In the Debug view, suppose that you want to go to next line. Press Shift + F6 on your keyboard (Step Over command). The currently-selected line (#46 in the displayed example) is executed and the test is again suspends on the next line (#47). Notice that, even though line #46 is never stepped into by the debugger, the action in that line is executed normally.