
Introduction
The TestArchitect Dashboard is a web–based application that connects directly to a TestArchitect repository and receives project information from it. This information can be presented as customizable graphs, charts, indicators, and reports to help you analyze and manage test projects.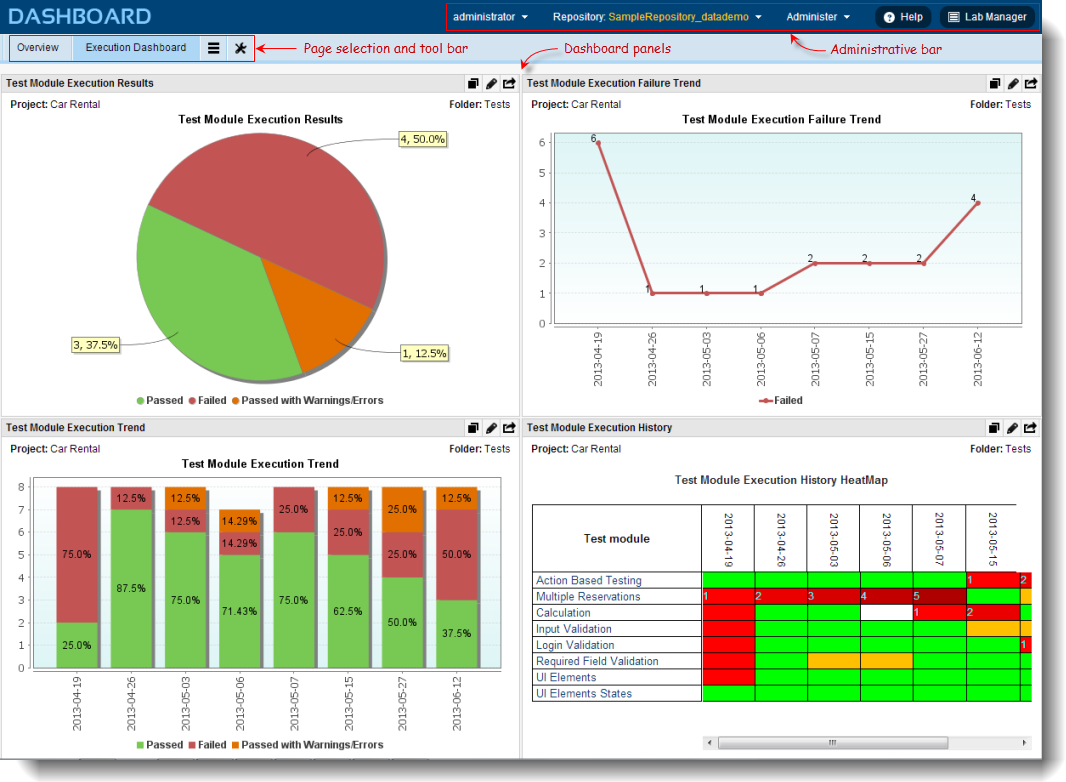
The layout of a Dashboard window (as shown above) consists of three main sections: administrative bar, page selection and tool bar, and Dashboard panels.
Administrative bar
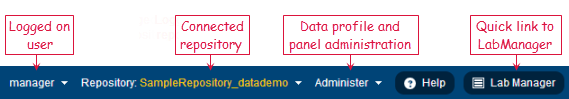
The administrative bar displays the logon user and the repository in use. Hover your mouse over the arrow to the right of the Repository field to display a hover menu presenting a list of other repositories to connect to. The Administer hover menu offers two options: Data Profiles and Panels. The Data Profiles page lists all data profiles (in tabular format) accessible on the Dashboard for the connected repository. Information from the data profiles is used to present data on customizable panels. The Panel page lists the names of user-defined panels; these panels serve as the starting templates for charts, indicators, reports, and heat maps.
Page selection tool bar
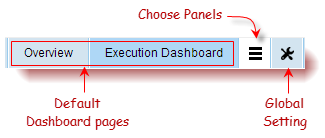
TestArchitect provides two default pages (Overview and Execution Dashboard) with sample charts displaying summaries of test executions relating to the repository repository of the sample Car Rental project. The Global Setting menu provides options allowing you to add a page, create a data profile, and create a panel. As an alternative to creating a new panel from scratch, selecting the Choose Panels button reveals a drop-down page containing a list of predefined panels. You may choose one of these to add a new panel to a page.
Dashboard window
A given Dashboard window is specific to a TestArchitect repository. It consists of one or more pages, each of which may contain multiple informational panels. Each panel displays user-selectable data as defined in the data profile based on the test run results. Selected data are displayed on a panel as a chart, indicator, report, or heat map.
Pages
A Dashboard page acts as a container for one or more panels, each of which displays metrics about your testing project. Panels are arranged in rows of two columns. You can view the panels to get the big picture of what is happening.
Panels
Each panel in a Dashboard page presents the information stored in the connected repository. When data in the source changes, all dependent panels update their presentations to reflect the change. Depending on the type of data, the panel can present data in the form of a chart, a report, a heat map, or an indicator, in which you can specify colors to indicate certain value ranges (for example, use the color red to indicate a failure count greater than zero).
Built-in predefined panels are provided to present the most commonly used TestArchitect test project information. But you can also define your own panels and add them to your pages.
Data profiles
Panels are based on data profiles. In a data profile, you specify which items (like test modules, actions, results, etc.) the data are gathered from, what fields of those items to include and how to organize them into presentable information, by means of filtering, sorting, grouping and/or calculation of statistics. This information defined in the data profile can then be presented in one or more panels, where you specify whether to display it as a chart, indicator, report or heat map.
Related concepts
