
Indicator settings
An indicator panel displays user-selectable data in a tabular format, in which data meeting a certain criteria can be highlighted for quick viewing.
An indicator panel consists of a table with three columns. The values in the first column are defined by the Statistic field in the indicator chart settings. Values in the second column reflect the respective values in the third column, but expressed as percentage. Values in the third column are raw numerical data relating to the items in the first column.
In the sample indicator settings below, recent result is selected as the Statistic field and its values are displayed in the first column of the indicator table. The third column (Count) holds the numerical counts for each recent result type. The second column (Percentage) contains the count number as percentage value when compared to the total recent results. Since Failed is selected for the statistic field Value and the Percentage check box is not selected, the From range specifies the lowest counts whose recent result Failed. Rows on the indicator table meeting the range requirements are indicated with colors as defined for each From range.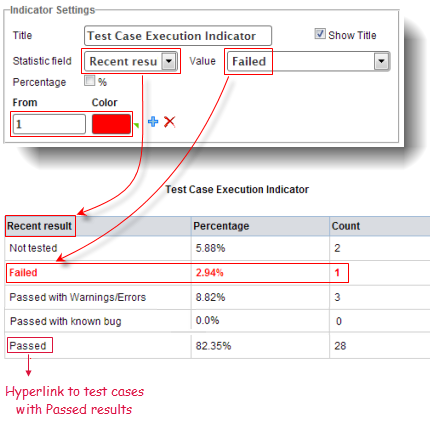
Each value under the first column of the indicator table is also a hyperlink to another page containing additional details for that value. For example, clicking on the Passed value under the first column in the above indicator table displays the following list of test modules with passing results. Each test module is also a hyperlink to its respective module in TestArchitect.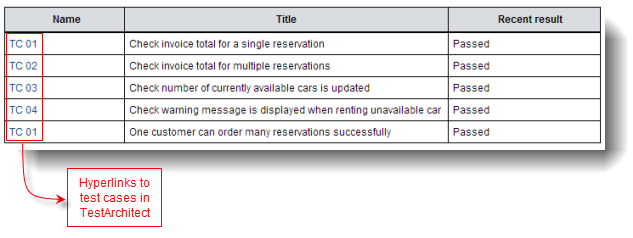
To add multiple indicator ranges, enter the lowest value for the range in the From text box and choose a color for that range. Click ![]() to add additional indicator ranges. The indicators for the range example below are as follows:
to add additional indicator ranges. The indicators for the range example below are as follows: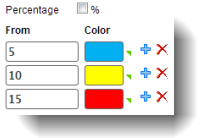
Since the Percentage check box is not selected for the indicator range in the above example, the rows with the statistic field value count from 5 to 9 are indicated in blue, 10 to 14 in yellow, and 15 and higher in red. For the indicator range below, the Percentage check box is selected, and, as a result, the percentage values are used to indicate ranges instead of the raw count values. Rows with percentages from 10 to 40 (non-inclusive) are indicated in blue, 40 to 70 (non-inclusive) in yellow, and 70 and higher in red.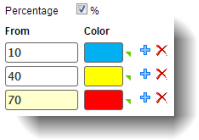
Creating a new indicator panel
Use an indicator panel to show numerical values of statistic fields in a table format. Values matching user definable range can be highlighted with different colors to indicate the level of importance.
Editing an indicator panel
The indicator’s appearance and data used to render the indicator can be modified at any time.
Related information
Category and series
Heat map settings
Report settings
Indicator settings
Chart settings
