
Creating a new chart panel
You can create panels containing pie charts, bar charts, or line charts to compare and track your test results and other project-related metrics.
To create a new chart panel on a Dashboard page:
Launch an instance of the Dashboard and log in to the session as a user with permission sufficient to create a panel.
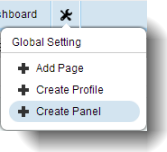
On the Dashboard’s page selection tool bar, point to Global Setting and select Create Panel.
In the Add New Panel dialog box, select the Chart radio button as the panel Type, and then enter the information as requested.
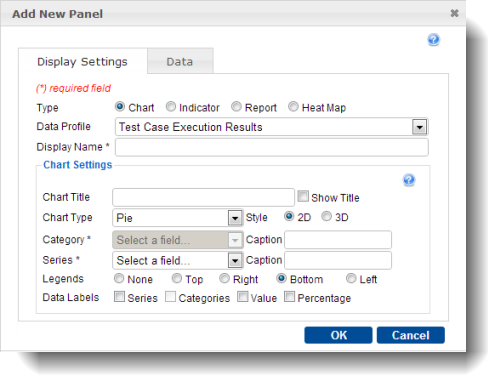
Display Settings tab: Use this tab to assign properties to the chart.
Data Profile: From the drop-down list, select a data profile containing a set of customized data to apply to the chart.
Display Name: Title of the new panel.
Tip:TestArchitect automatically appends an incremental number surrounded by parentheses (for example, “(1)” for the first duplication) to the panel’s Display Name for each name duplication.
Chart Settings:
- Chart Title: Name for the chart.
- Show Title: Show or hide the chart title when the panel is displayed.
- Chart Type: Type of chart to be presented on the panel.
- 2D: Display a two-dimensional version of the chart.
- 3D: Display a three-dimensional version of the chart.
- Category: Select the type of data from the data profile for the horizontal axis (abscissa) of the chart. See Category and series for details.
- Series: Select the type of data from the data profile for the vertical axis (ordinate) of the chart. See Category and series for details.
- Caption fields: Enter a caption for each axis.
- Legends: Select the position on the panel at which the chart’s legends are to be displayed.
- Data Labels: Select the caption for each group of data on the chart:
- Series: Use the values of the vertical axis to label each group of data on the chart.
- Categories: Use the values of the horizontal axis to label each group of data on the chart.
- Value: Use the raw numerical values of each group to label the group data on the chart.
- Percentage: Use the percentage values of each group to label the group data on the chart.
Optional: To restrict the data used by the panel based on the values of one or more data fields, select and enter the filtering expression(s) as needed on the Data > Filter Fields tab.
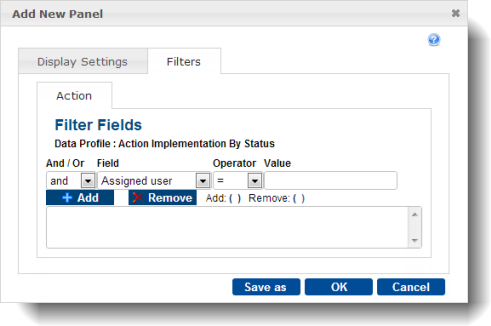
Filter Fields tab: Use this tab to create logical expressions to filter data on charts.
- And/Or: Logical operator for combining more than one filtering expression.
- Field: First operand in the logical expression.
- Operator: Comparison operator.
- Value: Second operand in the logical expression.
- Add: Add the user-defined logical expression to the filter list.
- Remove: Remove the highlighted logical expression from the filter list.
- Add: ( ): Add parentheses to the highlighted logical expression to override the default order of precedence.
- Remove: ( ): Remove parentheses from the highlighted logical expression.
Optional: After adding customized filters to the panel, if you want to save the new filtering expression(s) to a new data profile, click Save as on the Filters tab and enter the name of the data profile on the Save setting profile as text box, then click Save.
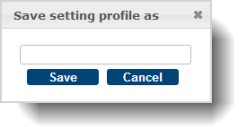
The Dashboard creates a new data profile based on the profile specified in the Data Profile drop-down list (on the Display Settings tab) with customized filters added. The logged-in user owns the newly created data profile, and this Dashboard panel uses this new profile.
In the Panel Configuration dialog box, enter the information as requested and click OK.
- Select page: Select the page on the Dashboard in which the newly add panel is to appear.
- Height: Set the height (in pixels) of the panel. A taller panel has higher resolution, producing sharper charts.
- Folder: Select a TestArchitect repository folder containing the report data you want to display on the new panel.
A detailed chart panel containing the requested information is added to the designated page. Depending on the type of chart you create and the data profile applied to it, hyperlinks to more detailed information on certain elements of the chart may be available. You can change the settings for this panel at anytime by clicking the Edit panel ![]() button on the upper-right hand side of the panel.
button on the upper-right hand side of the panel.
Related concepts
Related tasks
Editing a chart panel
