
Launching Dashboard
In this activity you will run through the steps required for opening a Dashboard portal into your project.
Before proceeding: You should have a familiarity with TestArchitect Client and its user interface. Also, observe the following:
Ensure that the TestArchitect Repository Server is running (as indicated by the
 icon in the Windows notification area). If not, start it up. start it up.
Ensure that the TestArchitect Utility Server TestArchitect Utility Server (which manages the Dashboard application) is running.
Start the Dashboard.
a. On the TestArchitect explorer tree panel, right-click on the repository node that you want to view with the Dashboard, and then select Show Dashboard.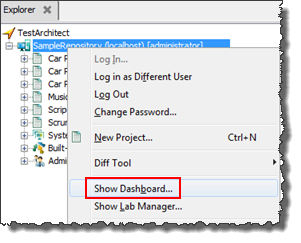
Alternatively, from the Repository menu, click Show Dashboard.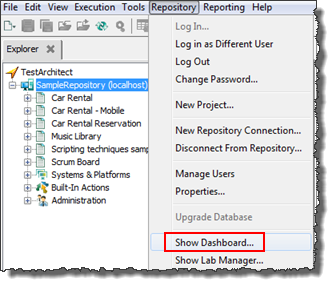
If you are not yet logged in to the Sample Repository, the Dashboard main login page opens in your default browser: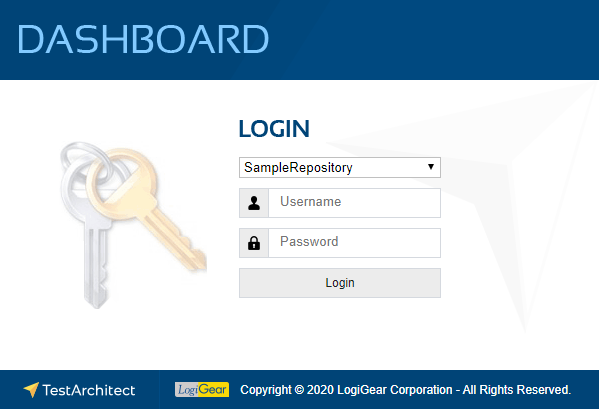
b. On the TestArchitect Dashboard Login page, select SampleRepository from the repository drop-down list. Enter Administrator for the Username and leave the Password field blank, and then click Login to start the Dashboard.
The Dashboard display appears in your browser. Assuming this Dashboard portal has not yet been modified, it appears with several sample panels assigned to two pre-defined pages, Overview and Execution Dashboard: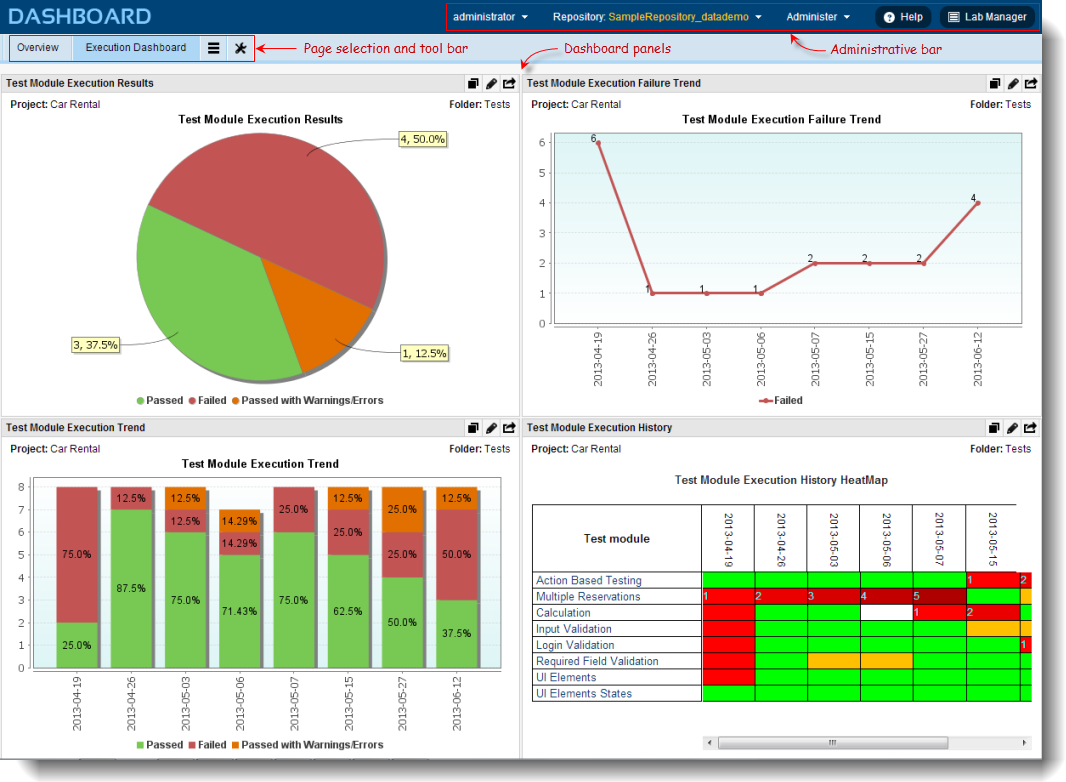
What you have learned:
- How to launch and log on to the TestArchitect Dashboard.
